SiteCanopy: Crawl a Website and Map Every API Each Page Calls
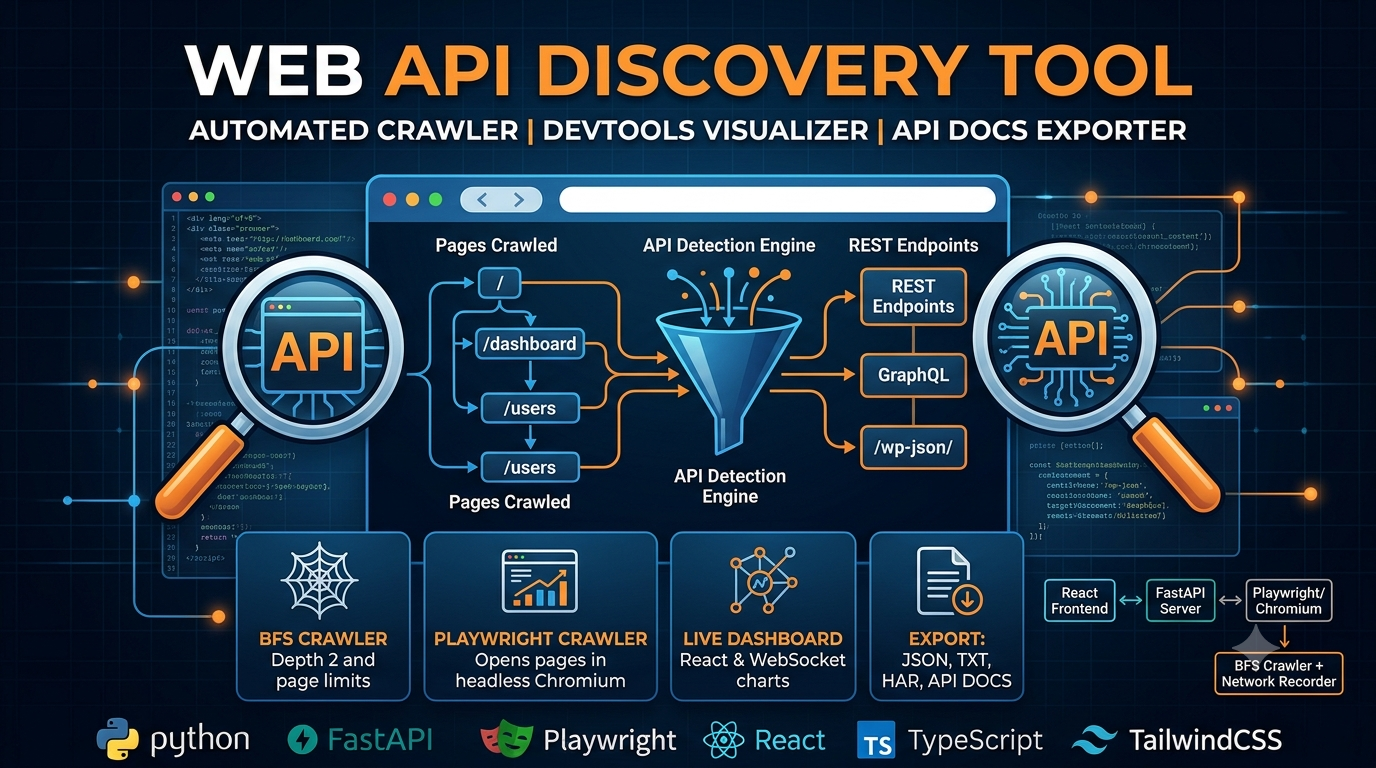
You can’t grep a website for its APIs. The endpoints that matter — REST, GraphQL, XHR — only exist at runtime, fired by JavaScript after the page loads. The usual way to find them is DevTools, Network tab, one page at a time. I wanted that as an automated pipeline instead, so I built SiteCanopy: a BFS crawler in headless Chromium that records every network call on every page and tells you which ones are APIs.
Here’s how it actually works under the hood.
Capturing traffic
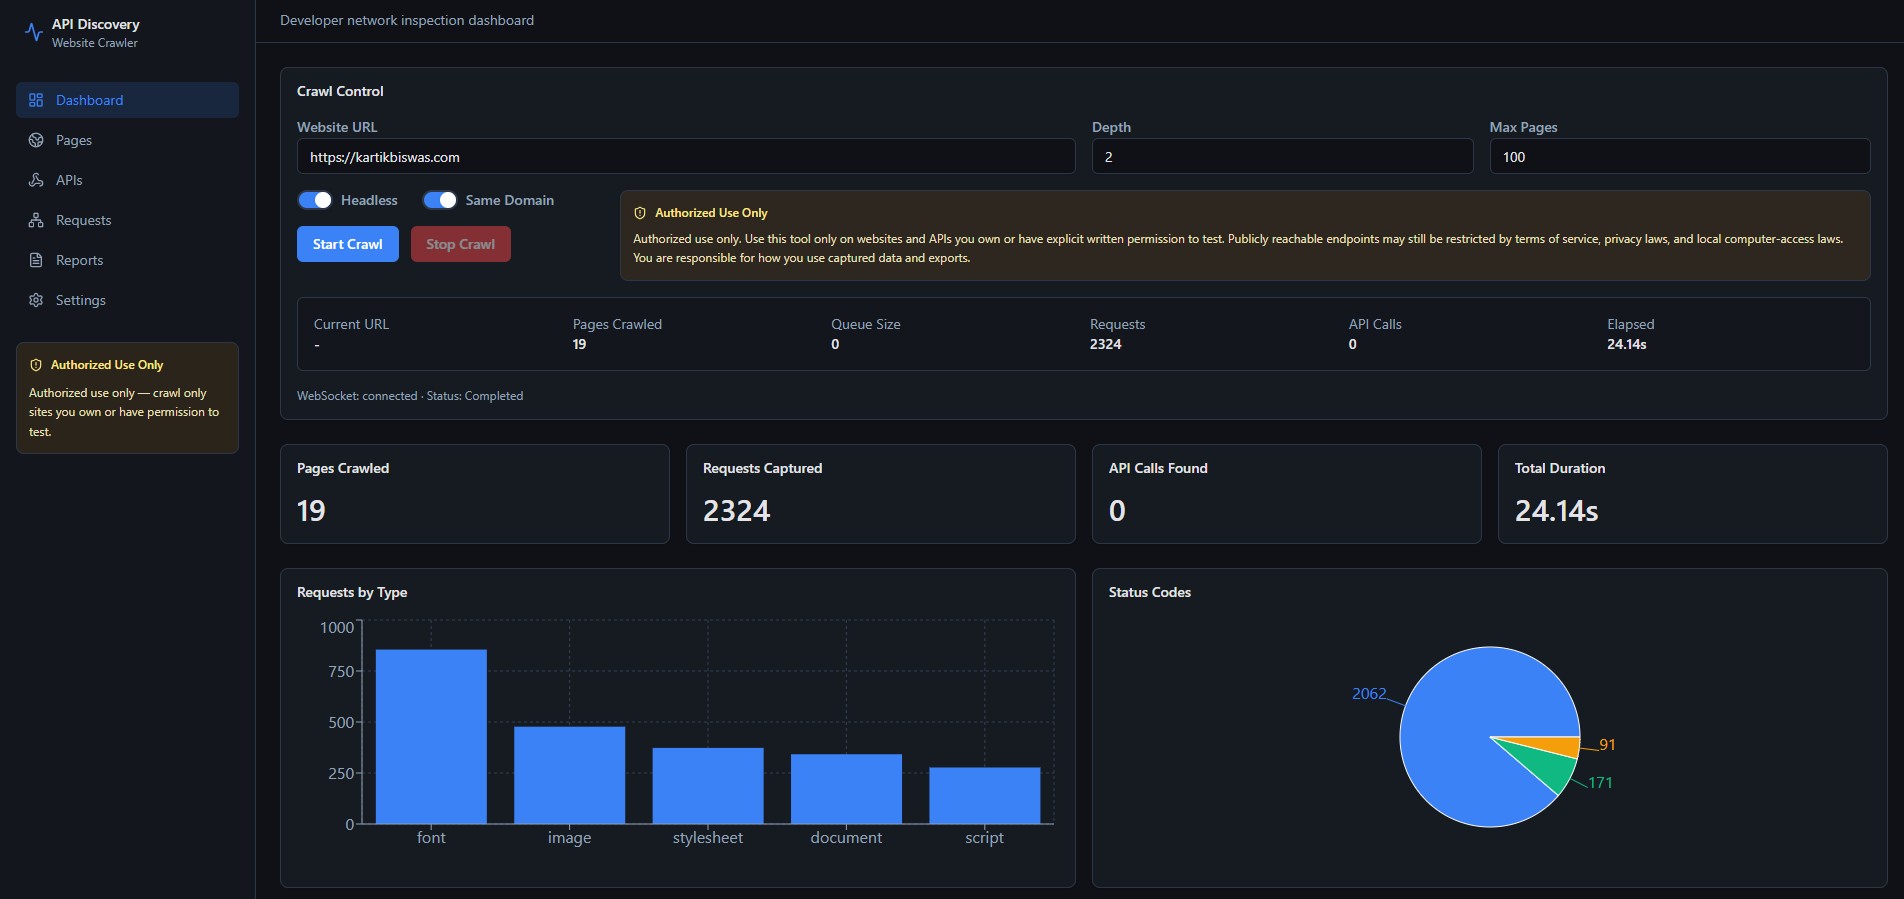
The crawler drives Playwright and hooks the full request lifecycle — request, response, requestfinished, requestfailed — so nothing fired during a page load is missed, including calls that error out. Each page is a BFS node: extract links, filter to same-domain, dedup against visited, enqueue, repeat until depth or page limits hit. Every captured request is normalized into a typed record (method, URL, status, resource type, headers, content-type, timing).
Classifying APIs
No ML here, and that’s a deliberate call — on real SPAs, rules are both more accurate and fully explainable:
def is_api_request(url, resource_type, headers, response_headers):
    if resource_type in ("fetch", "xhr"):
        return True
    if any(m in url for m in ["/api/", "/graphql/", "/wp-json/"]):
        return True
    if "json" in content_type:
        return True
    return False
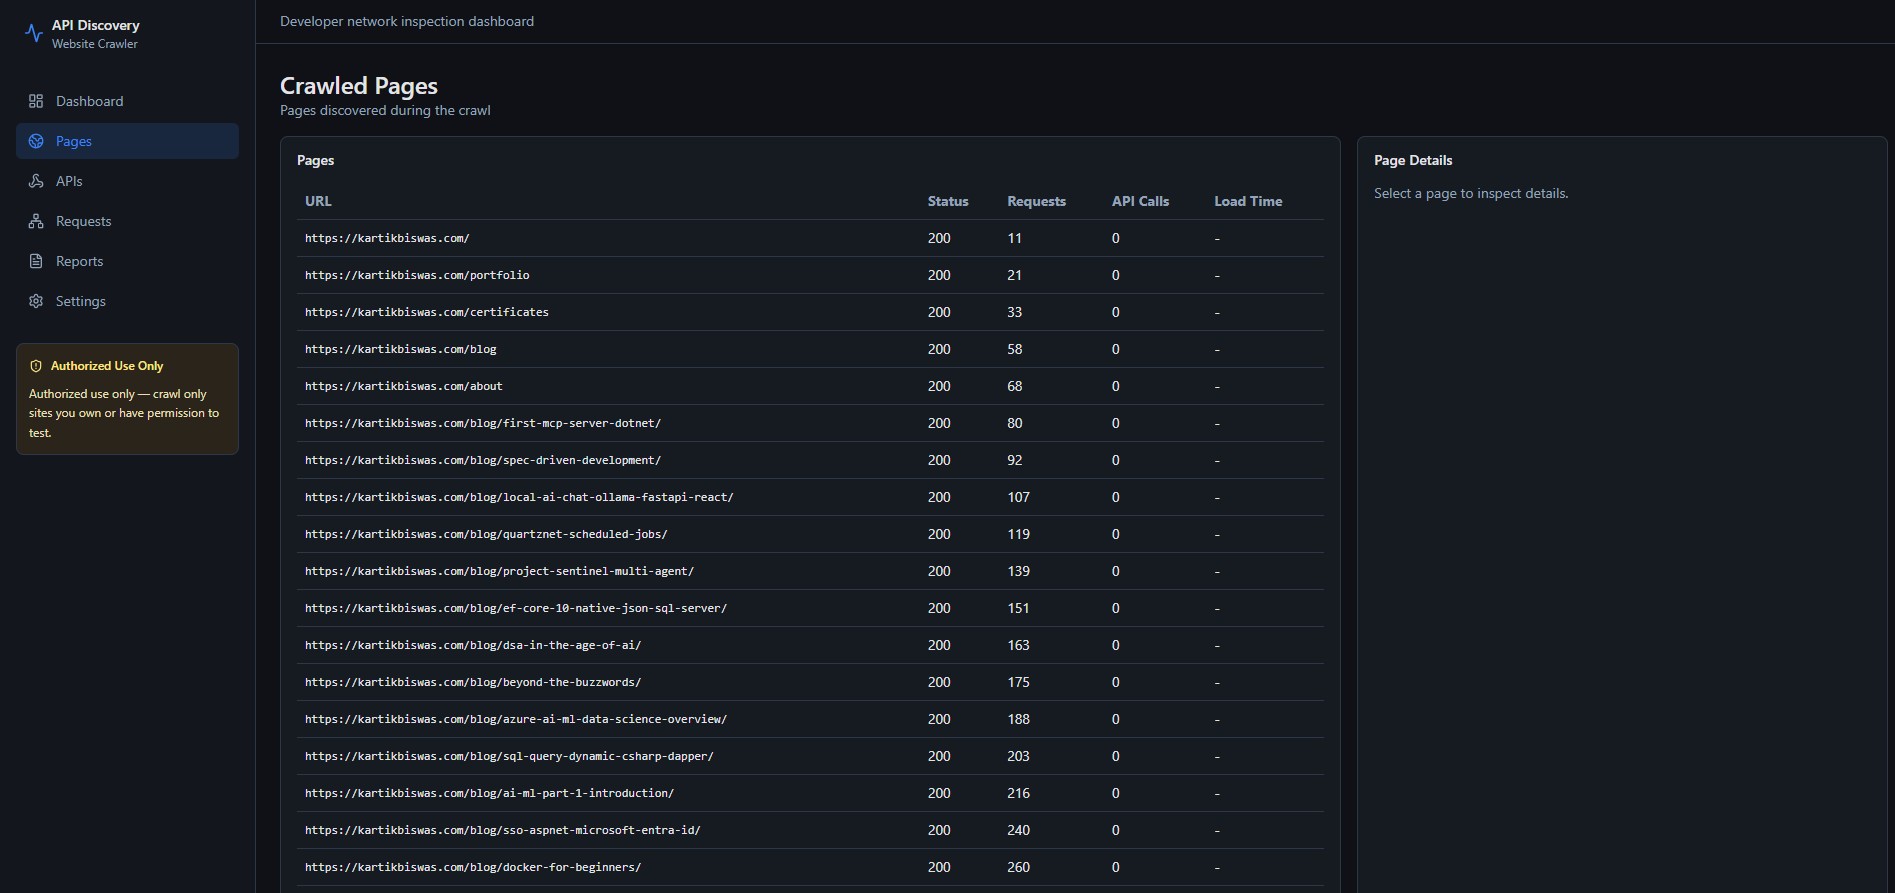
Endpoints are then grouped by (method, normalized URL) with call counts, so a call made on 30 pages collapses to one row you can reason about.
The REST + WebSocket surface
The whole thing is driven by an API, not just the UI — so it scripts into a pipeline:
POST /api/crawl/start      → background crawl (non-blocking)
GET  /api/crawl/status     → live status
GET  /api/api-calls        → API-only traffic
GET  /api/api-summary      → grouped endpoint summary
GET  /api/export/har       → HAR for DevTools import
GET  /api/export/api-docs  → deduplicated API docs (Markdown)
A WebSocket at /ws streams progress live — current URL, pages crawled, queue size, requests captured, API calls found — broadcast from a single in-memory state manager to every connected client.
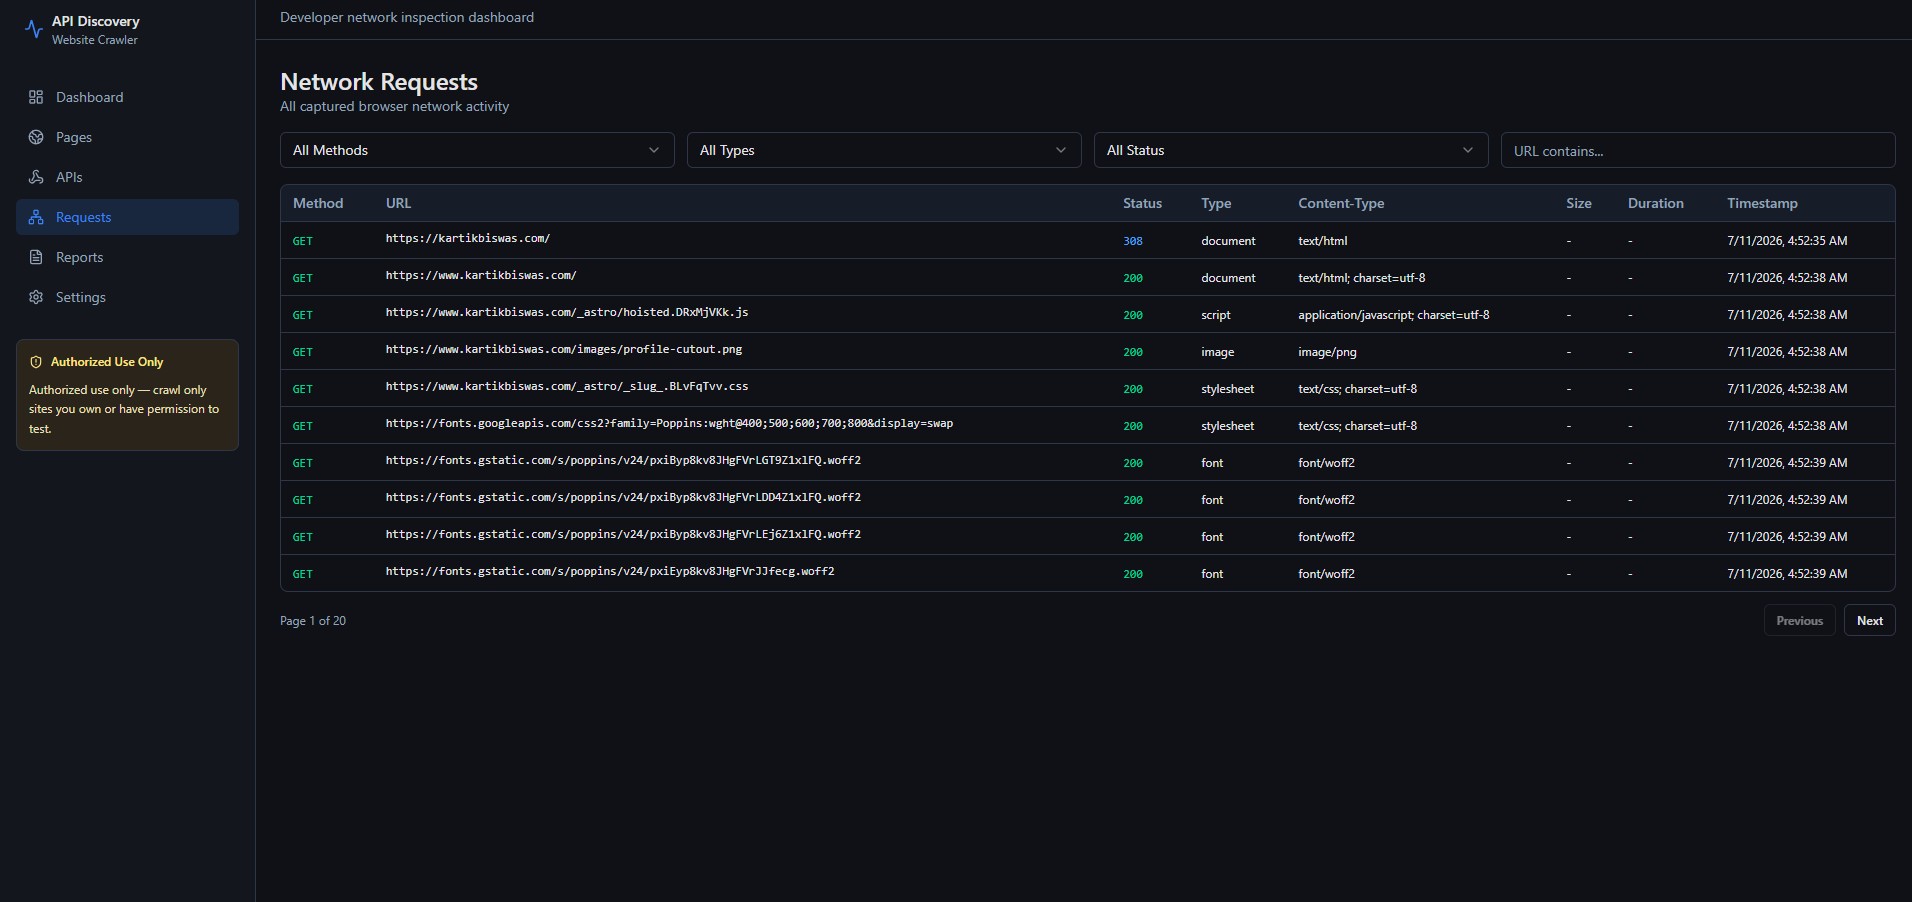
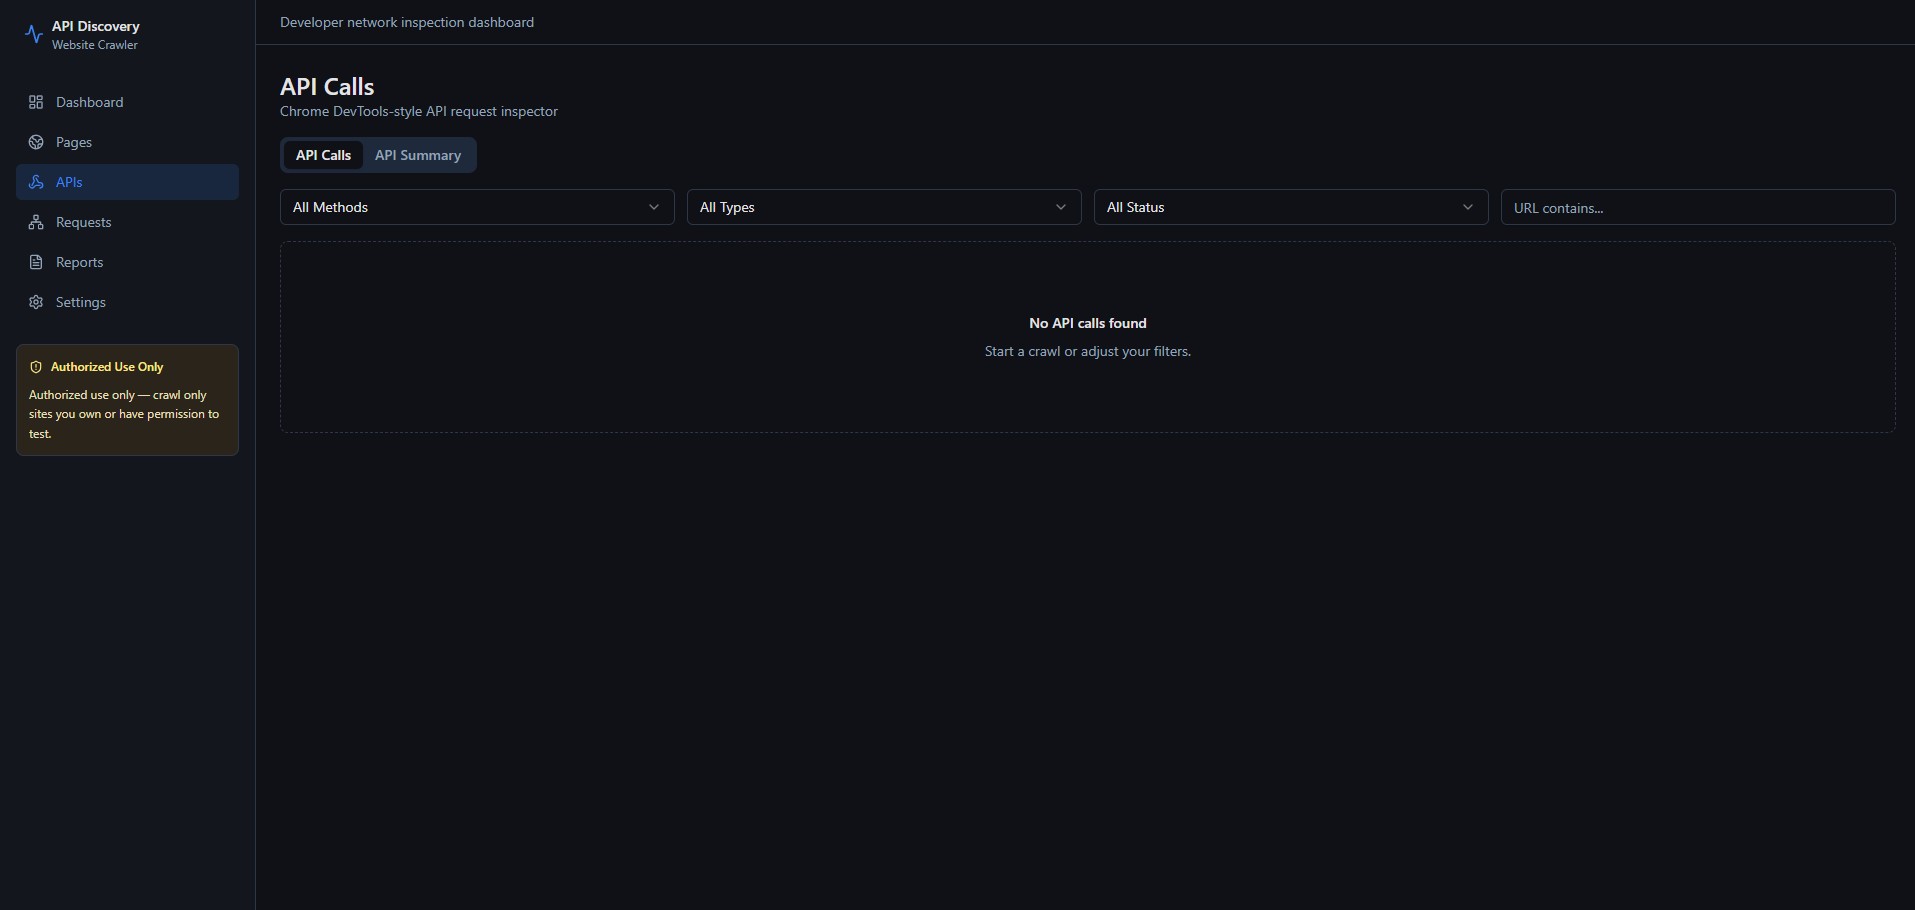
API call inspector, DevTools-style, with filters
Every request is captured and filterable by method, type, and status:
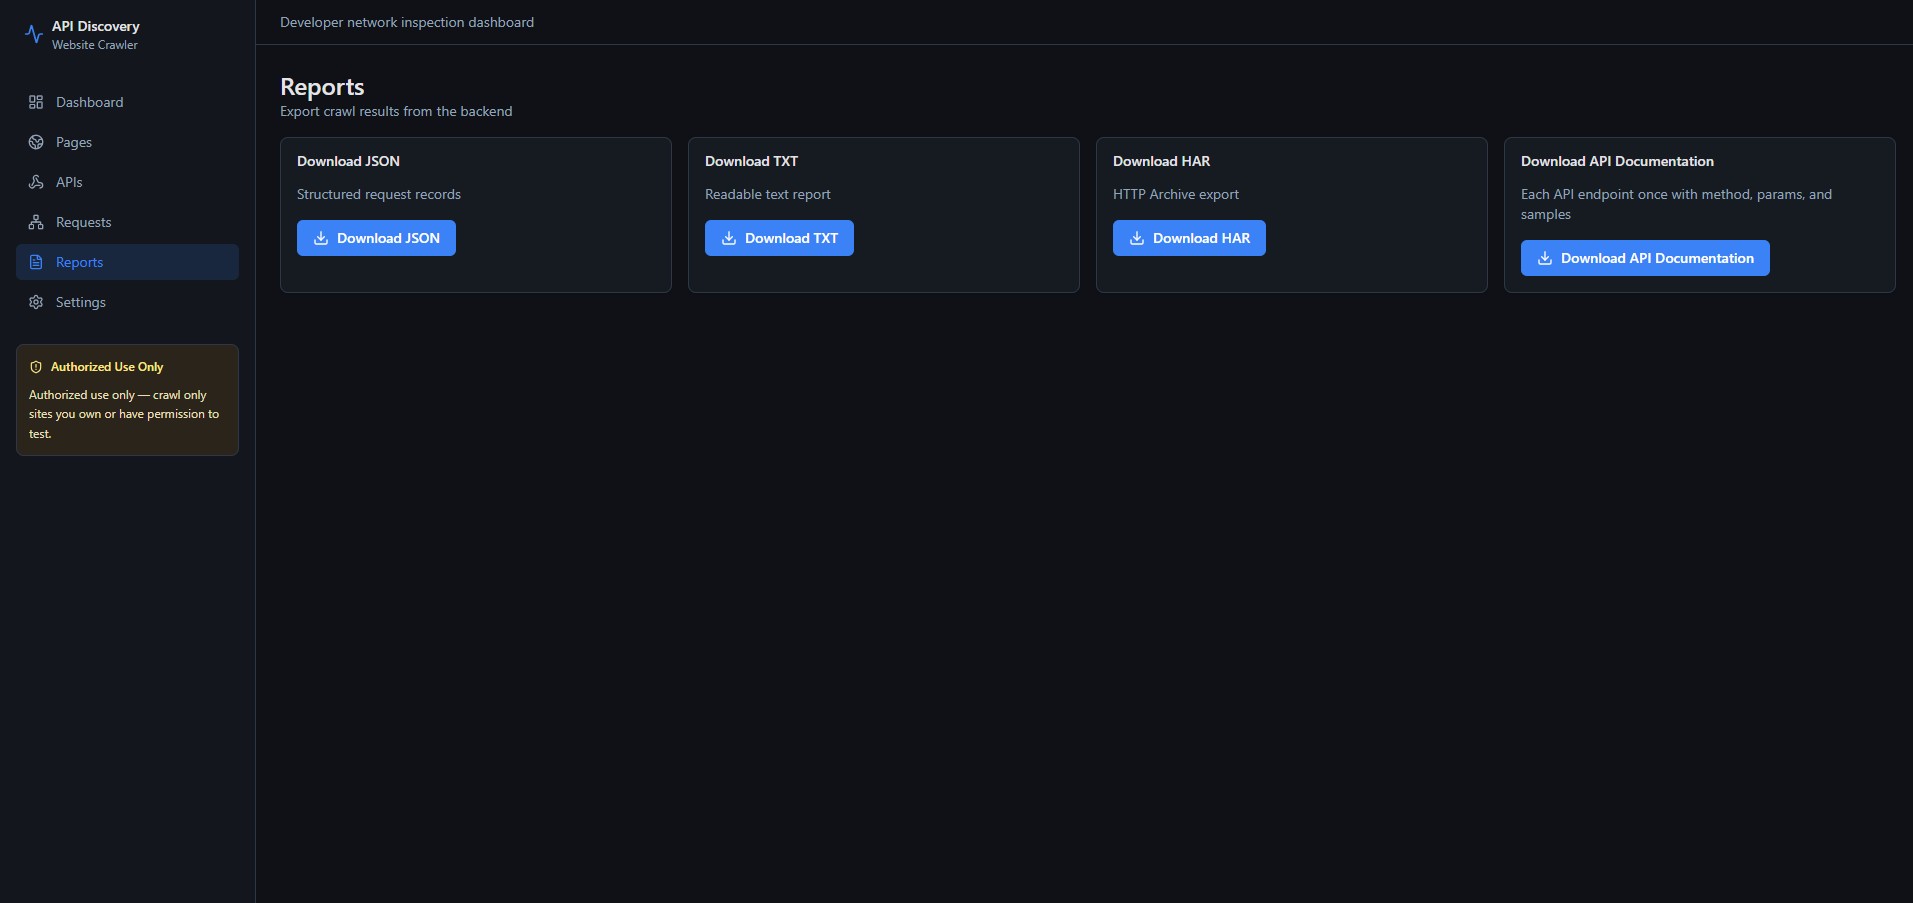
The export that earns its keep
Each unique endpoint appears once, with method, call count, status codes, query params, and the pages that triggered it:
## GET https://example.com/api/users
- Times called: 3
- Status codes: 200

### Query parameters
- page — example: 1

### Triggered from pages
- https://example.com/ · https://example.com/dashboard
Architecture
React dashboard  ⇄  FastAPI server  ⇄  Playwright / Chromium
                        ↓
              BFS crawler + network recorder
Backend: Python 3.12 · Playwright · FastAPI · Pydantic · Typer · BeautifulSoup4 Frontend: React 19 · Vite · TypeScript · Tailwind · TanStack Query/Table · Recharts
The domain core is shared: the same crawler and exporters back both a Typer CLI and the FastAPI server, and schemas are typed end to end — Pydantic on the backend, TypeScript on the frontend.
The bug that actually cost me time
Running Playwright under FastAPI on Windows fails in a way that isn’t obvious: the ProactorEventLoop uvicorn wants and the loop Playwright’s subprocess transport needs conflict, and you get intermittent, ugly async failures. The fix was to run the browser in a dedicated worker thread with its own event loop, and marshal results back to the async server. Not glamorous — but it’s the difference between “works on my machine” and “works.”
What it doesn’t do, so we’re clear
- Captures APIs fired on page load — not interaction-driven calls behind clicks or scroll
- No auth flow, so gated pages are out of scope
- In-memory state, cleared on restart
- Heuristic detection — high signal, not infallible
- Authorized use only — your assets, or ones you’re permitted to test
Free and open source. Fork it, script it, tell me where the detection heuristics fall over: github.com/onsaurav/website-api-discovery